Systems integration
Measure OEE before you approve the automation budget, not after
Overall Equipment Effectiveness, split into its three components, tells you which problem you are actually funding a fix for. Installed as a dashboard after the equipment already runs, it tells you nothing you can act on.
Executive summary
85%
world-class OEE per Nakajima's TPM benchmark, reached by roughly 6% of manufacturers globally
42%→75%
Hutchinson's average OEE gain across 40 sites in 12 countries
Core conclusions
- OEE should run before the automation spend is scoped. The composite figure alone cannot say which component is broken.
- A low score in Availability, Performance, or Quality calls for a different fix: condition monitoring, cycle-time instrumentation, or in-line inspection respectively.
- Most of the gap between the 85% benchmark and the ~55–60% broad average is a measurement failure: nobody split the number apart before buying.
Most automation proposals get approved before anyone has measured the line they are meant to fix. Eighteen months later nobody can say whether the investment corrected a machine that kept stopping, one that ran slow, or one that produced bad parts, because nobody recorded which of the three was broken before the money was spent.
Overall Equipment Effectiveness is the diagnostic that should run before scoping. OEE multiplies three independent scores (Availability, Performance, and Quality) and a plant with a real problem in one of them can look identical to a plant with a real problem in another until someone actually splits the number apart.
The three components measure three different failures
Seiichi Nakajima's original Total Productive Maintenance framework sets 85% as world class, built from roughly 90% Availability, 95% Performance, and 99.9% Quality. A low score on any one of the three calls for a different kind of automation spend:
| Component | What a low score means | What tends to fix it |
|---|---|---|
| Availability | Unplanned stops and changeovers: the line is down when it should be running. | Condition monitoring, quick-changeover tooling, spares management |
| Performance | The line runs slower than its rated speed, with no stoppage recorded anywhere. | Cycle-time instrumentation, bottleneck rebalancing, operator scheduling |
| Quality | Output that has to be reworked or scrapped after a full production cycle. | In-line inspection, process control, incoming-material checks |
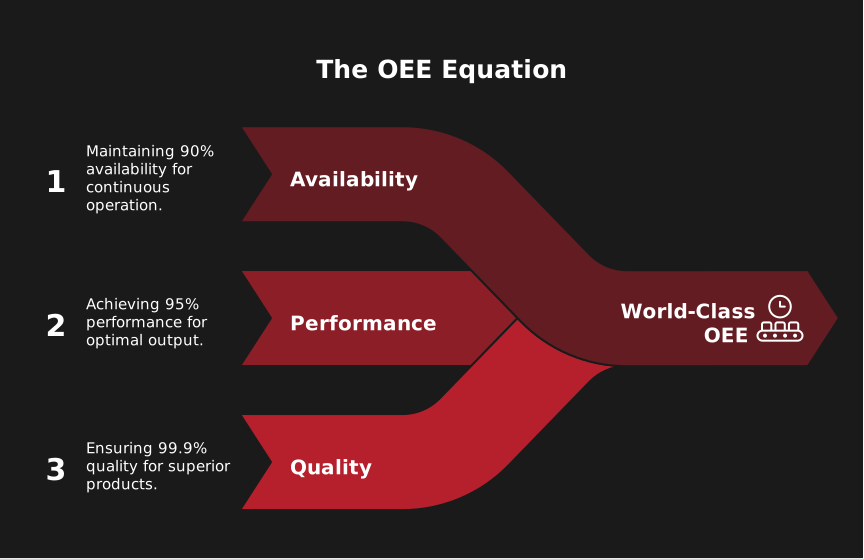
What to measure before scoping the spend
- Run OEE for at least two full production cycles before writing the automation brief.
- Split the number into its three components. The composite alone cannot tell you what to buy.
- Check how the current figure was calculated. Excluded downtime categories and inflated cycle times are the most common reasons a plant reports 85%+ that will not survive a second audit.
- Name the component the proposed automation is meant to move, and by how much, before it is approved. Afterwards, the dashboard is the only evidence anyone has.
The gap between the benchmark and the plant floor
The 85% figure is cited constantly and reached rarely. Evocon's benchmark analysis, drawn from tracked production data across more than 50 countries, puts the share of manufacturers actually reporting 85% or above at around 6% globally, against a broad average sitting closer to 55–60%. Most of the gap comes down to nobody having measured which component was failing before deciding what to automate.
Where that measurement happens first, the recovery is real and it is documented: Hutchinson, a Tier-1 automotive supplier, lifted average OEE from 42% to 75% across 40 manufacturing sites in 12 countries, a result reported in TeepTrak's published case study of the programme. That is a 33-point gain traceable to specific sites and a specific baseline.
The order matters more than the technology choice. Measure the three components, name the one that is broken, then scope the automation that fixes that component.