
Resources · Tool
Predictive Maintenance Viability Screener
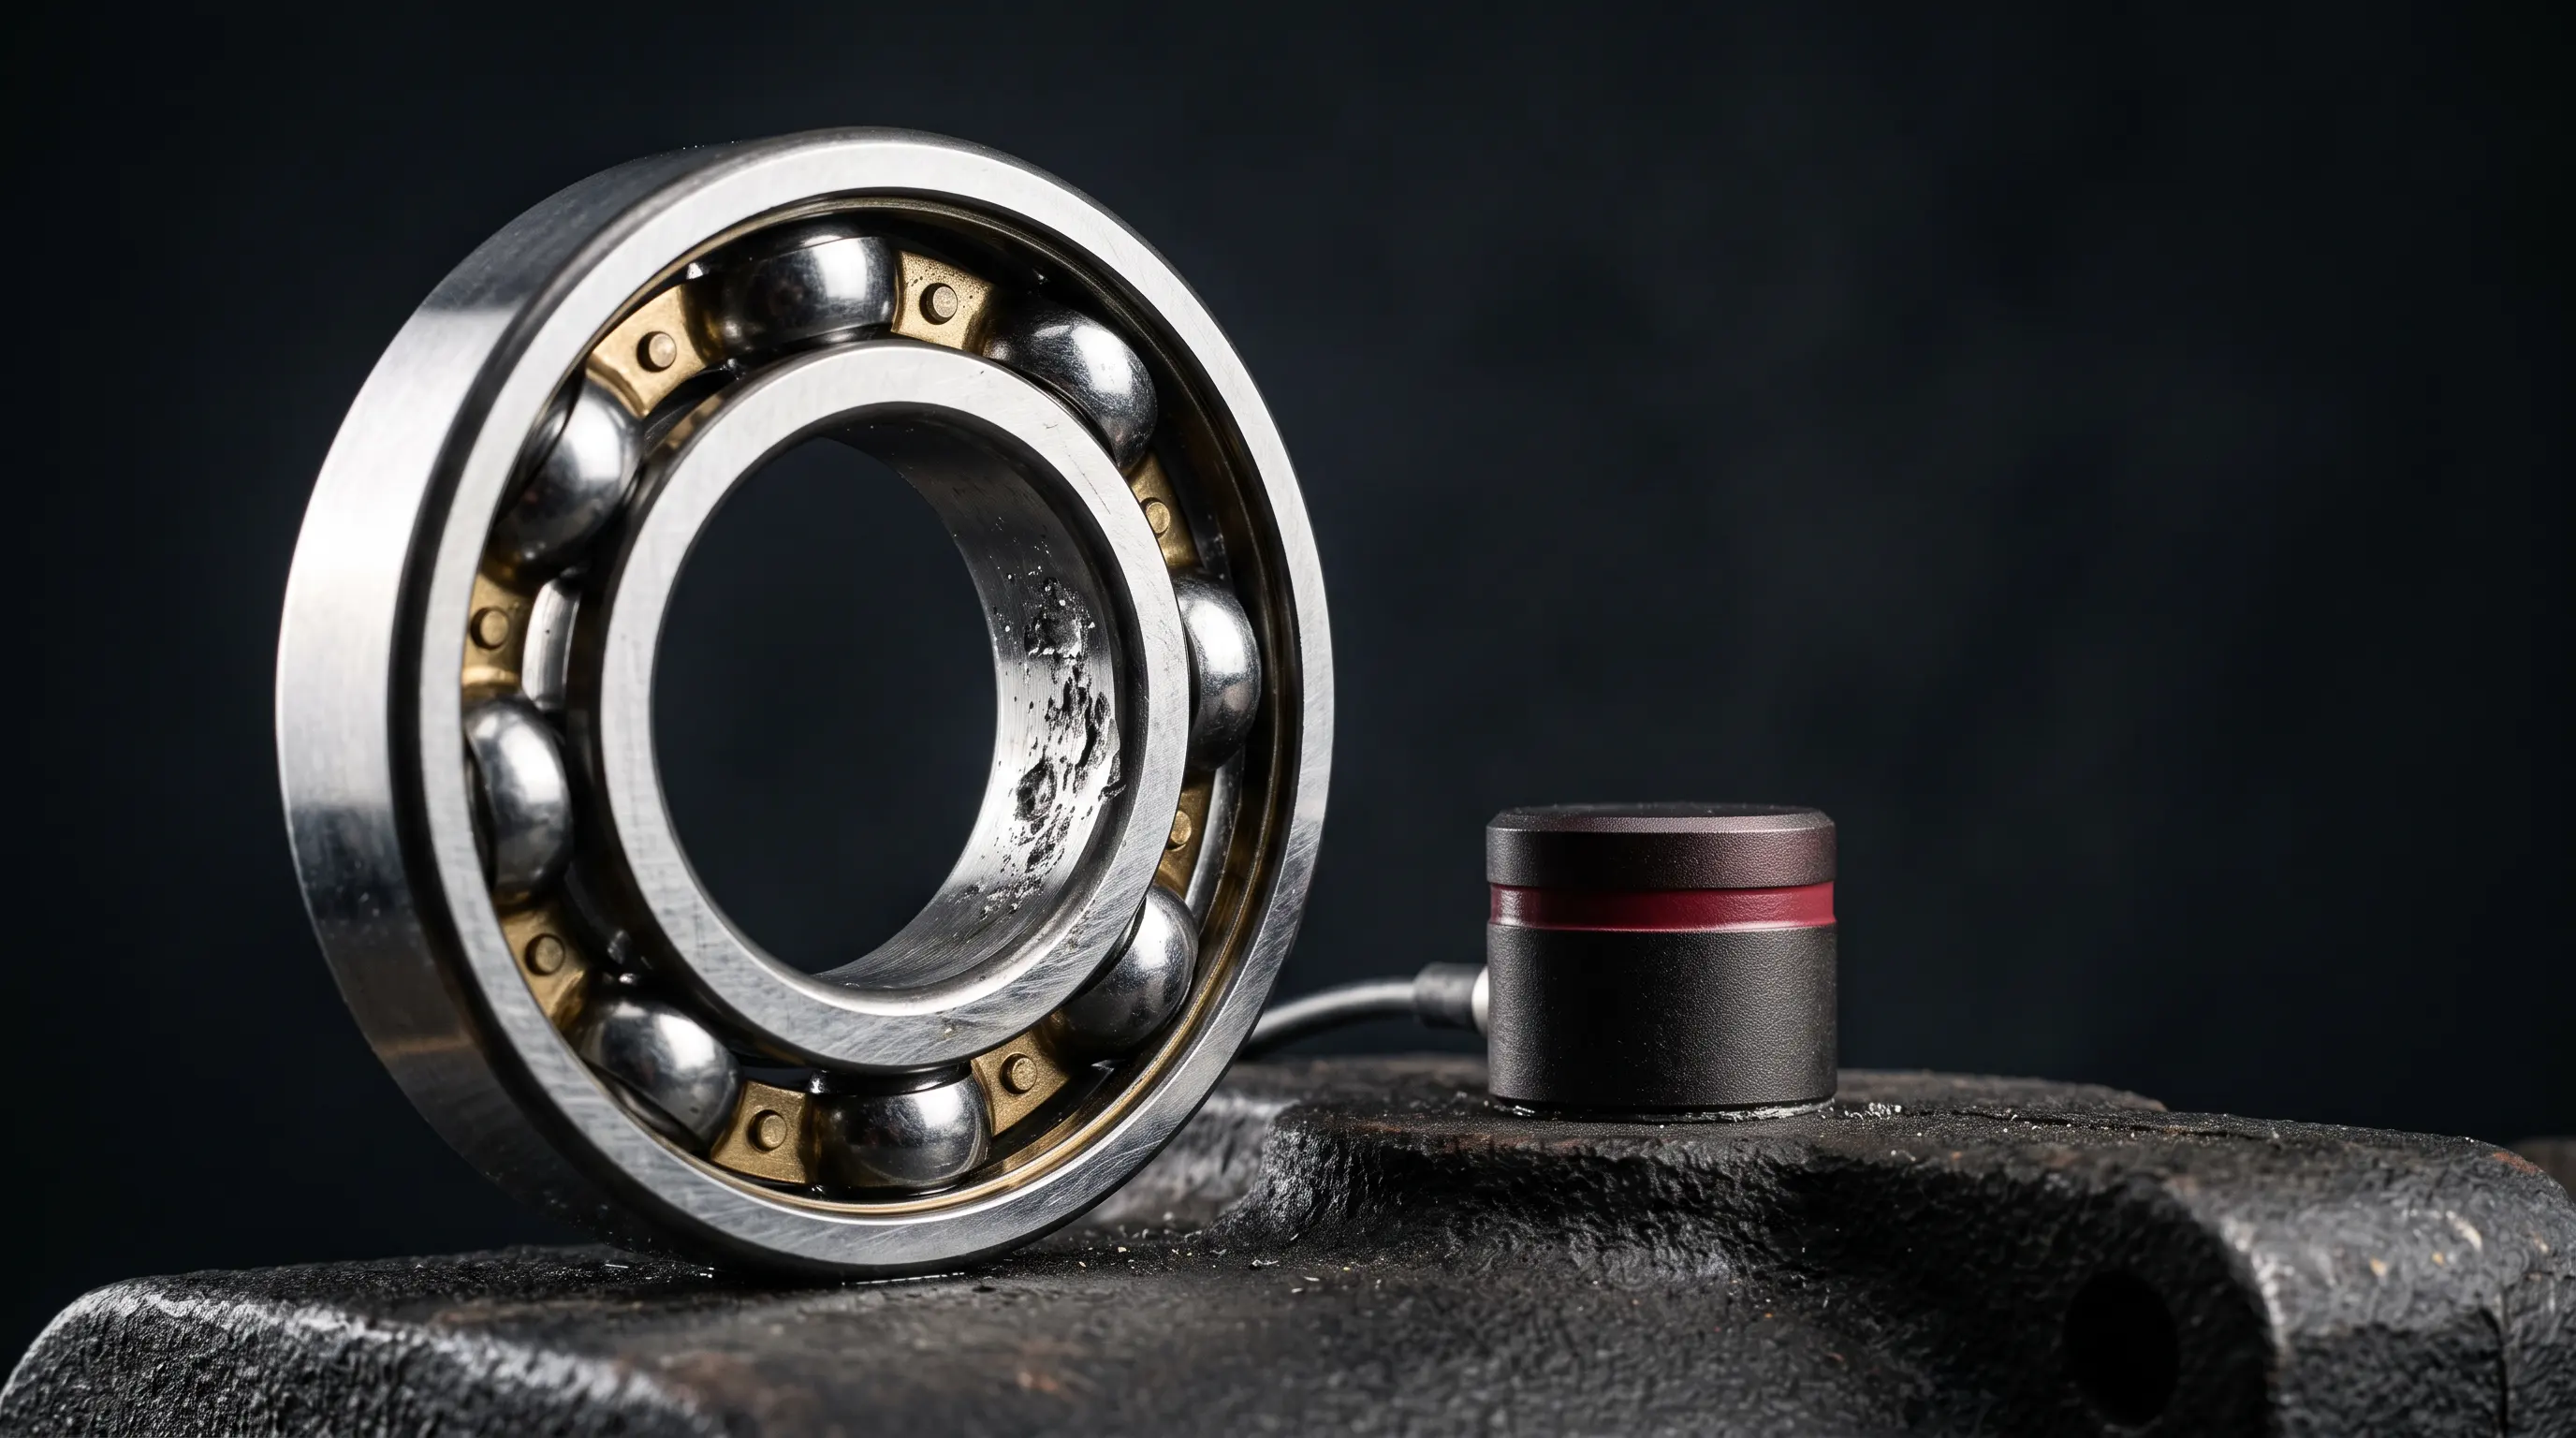
Condition monitoring detects specific degradation through specific physics. Vibration finds bearing wear; thermography finds loose connections; nothing at all finds a control board failing without warning. Score one asset class and failure mode at a time, then add it to the project below. A real project usually has several, and the total adds up what is actually worth monitoring without pretending a stop verdict on one asset class became a go by averaging it into the rest.
Everything below runs in your browser. Nothing you enter is sent to us, stored, or logged, and closing the tab discards it. Answer for one failure mode at a time. 'Predictive maintenance on our pumps' is not yet a project; the failure mode is what decides everything. Add as many asset classes as the project actually has. The project total keeps each one's own verdict and never blends them into an average.
The asset
UNIT 01The asset type sets the context. The failure mode below is what actually determines whether any of this is possible.
The failure mode
UNIT 02Take the mode that has actually been causing your stoppages, whichever one you would most like to predict. Two of these cannot be detected by condition monitoring at all, and the tool says so.
What is already there, and how hard it is to reach
UNIT 03Both of these move the installation cost, sometimes by more than the sensors themselves.
What it costs you now
UNIT 04Estimate from what has actually happened over the last two or three years, whatever the maintenance plan assumes.
For this failure mode specifically, on one asset.
From the stop to running again, including waiting for parts and people.
Lost margin, idle labour, penalties, and the cost of the recovery itself. The sale price of what was not made is a different number.
How many assets of this kind share this failure mode. This is the number that decides whether monitoring pays.
Verdict
UNIT 05Viable, narrowly
Complete the inputs to see a verdict
Pick the asset and the failure mode, then give the tool a failure rate, a downtime figure and an hourly cost. It cannot form a view without them, and it will not pretend to.
Project total
UNIT 06Every asset class added above, on its own terms. Nothing here is averaged across failure modes that do not share the same physics. What follows is the sum of what each one actually contributes.
Not the right tool, at this scale
Add at least one asset class to see a project total
Score one asset class and failure mode above, then add it to the project with the button on its result. The total here adds up as you go; there is nothing to total from an empty project.
The P-F interval
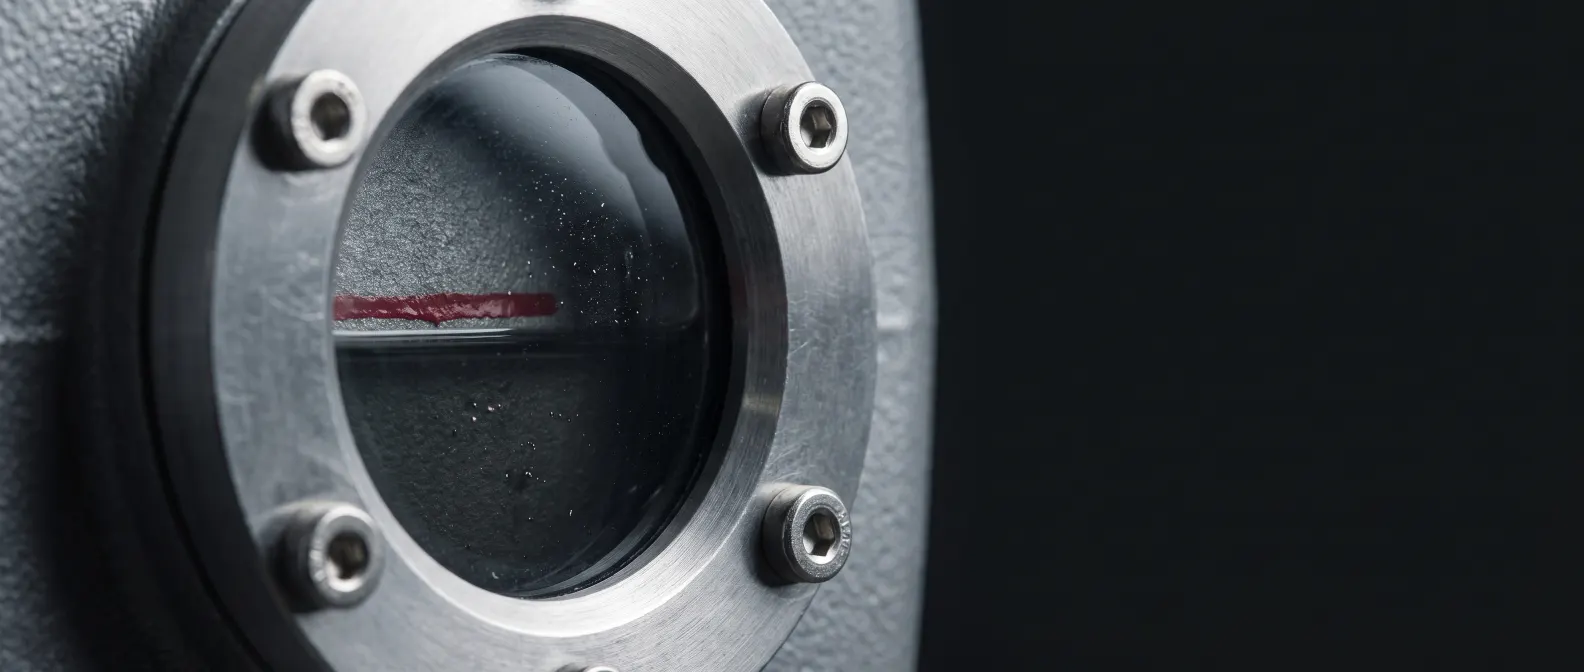
UNIT 07The number that decides everything on this page is the interval between the point at which a failure first becomes detectable and the point at which the asset actually fails. Maintenance engineering calls it the P-F interval, and it is the whole reason condition monitoring is worth anything.
If that interval is months, monitoring buys planning: you order the part, book the window, and change the bearing on a Tuesday. If it is hours, monitoring buys an alarm that arrives too late to act on, and the honest recommendation is redundancy or a spare on the shelf. If there is no interval at all, which is the case for most electronic failures, there is nothing to detect, and no sensor changes that.
The avoidable share is capped at 70% of exposure before detectability is applied. A warning still has to arrive, be believed, and be acted on inside the interval, and the planned intervention still costs something. Business cases that assume monitoring eliminates a failure mode entirely are the ones that disappoint at the first review.
Technical references
UNIT 08What the reasoning on this page is drawn from. Where a standard costs money to read it is marked, and where a free document covers the same ground better it is listed first.
- SAE JA1011Paid standardSAE InternationalThe evaluation criteria for reliability-centred maintenance. The discipline behind asking which failure mode before buying any sensor.
- IO-LinkIO-Link CommunityThe sensor-level standard. The cheapest route to device diagnostics in any new installation, and widely fitted but unread.
- Modbus specificationsModbus OrganizationThe protocol specifications, published free. Worth reading the application protocol document once if anybody is quoting you for Modbus work.
Links open in a new tab so anything you have entered above survives. Every one was checked at build time; if one has rotted since, tell us and it comes out rather than getting patched from memory.
Every one of these tools is a compressed version of a conversation. If yours turned up something you would rather talk through than read about, that is what the scoping call is for — bring your result with you.
Also on the shelf
- Tool
Readiness assessment
Score a proposed integration across the five dimensions that decide whether it survives contact with a plant floor, and find out which one is your binding constraint.
- Tool
Payback calculator
Work out the recoverable hours, the build cost band and the payback period on a process you are thinking of automating, including the case where the answer is don't.
- Tool
Scope estimator
Describe the equipment, the sites and the compliance load, and get the complexity band, the ranked cost drivers and an engineering duration range.